¶ Focus Page Guide
¶ Overview
This guide will cover everything under the Focus Page tab. This includes where to find shared focus views, what a focus view looks like, how to make one, and how to edit one.
¶ Why Use a Focus View?
¶ What is a Focus View?
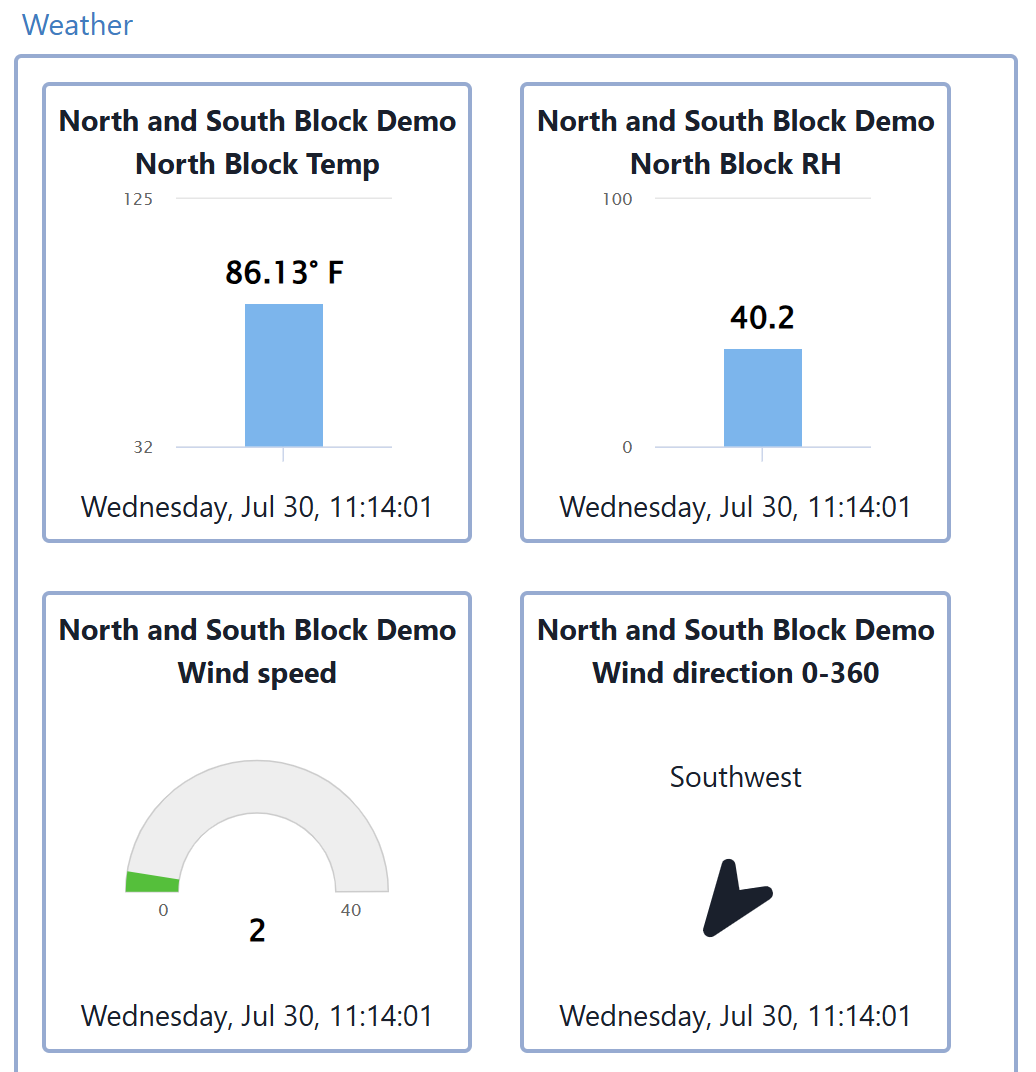
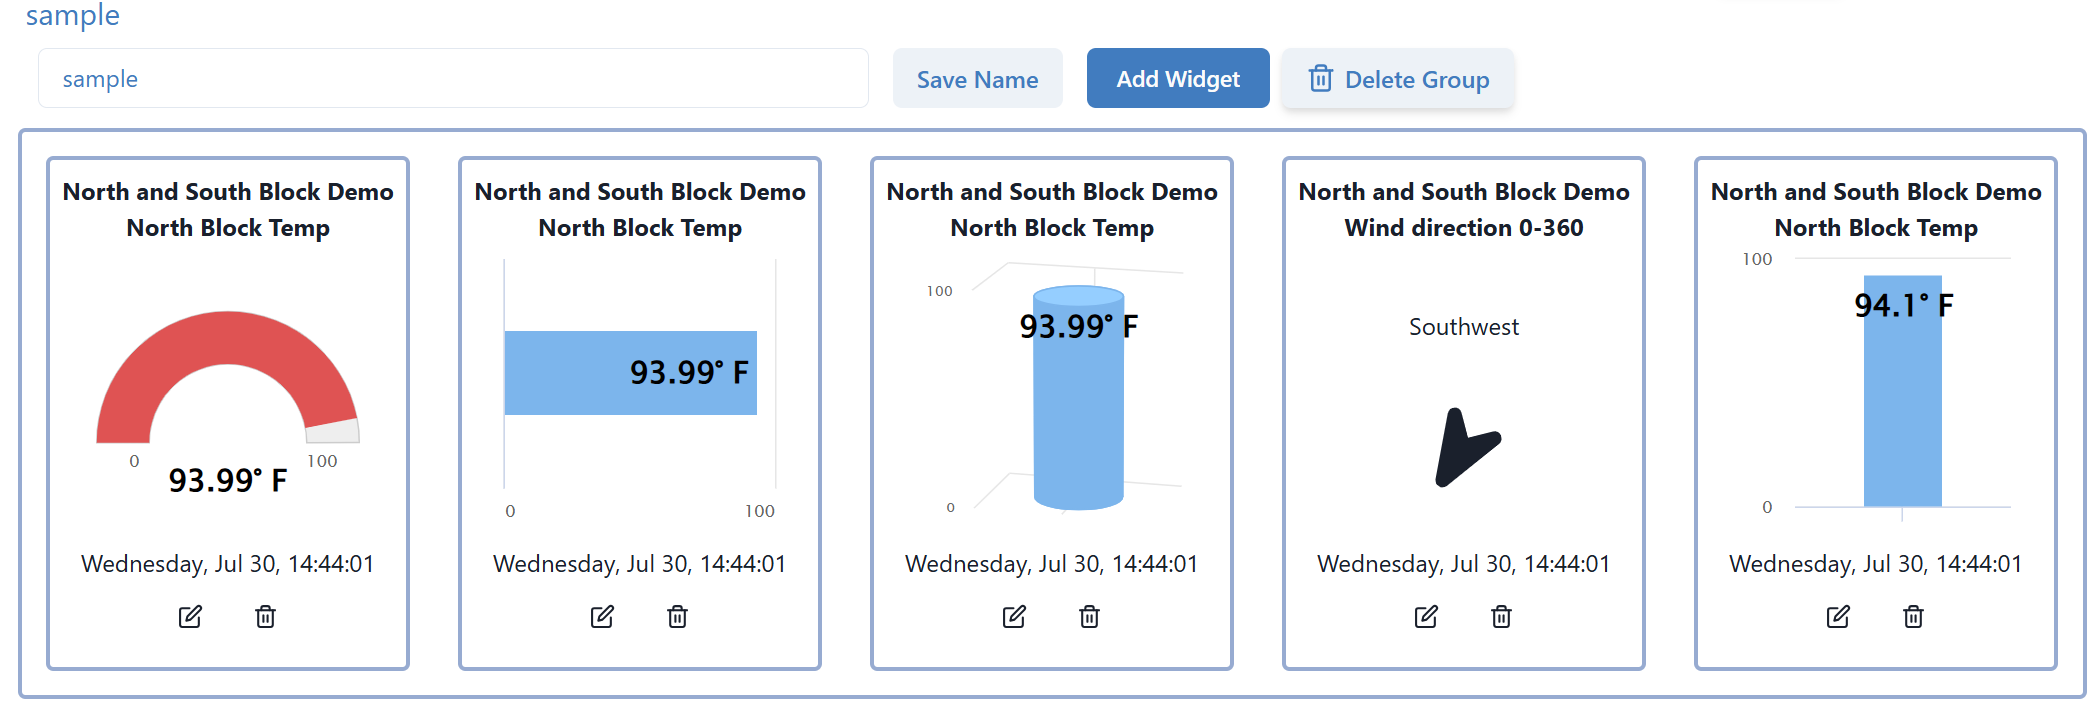
Focus views are a way to organize sensors into groups of widgets. These widgets give you real time data of any sensor you chose allowing you to monitor the status of your environment anytime you want. This monitoring can come in the form of graphs, bars, or arrows depending on the kind of sensor you chose.
|
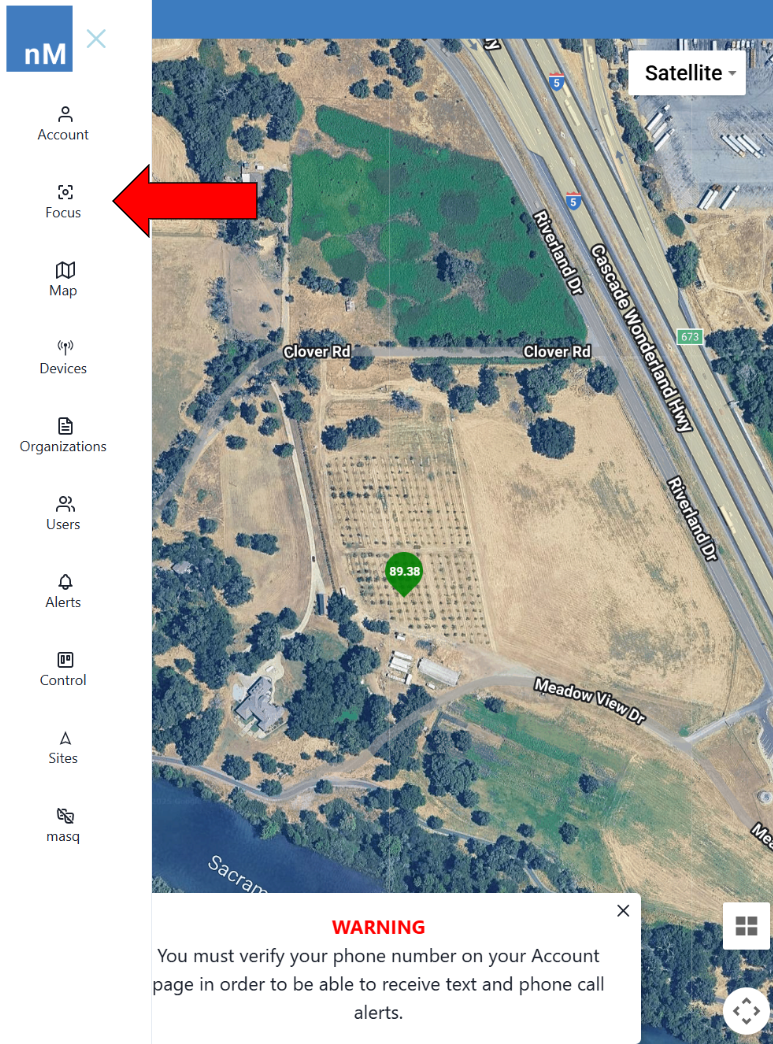
¶ Navigating to the Focus Page
Starting on your default page, look on the left side of screen for the Focus button or open the Hamburger menu on the top left corner of your screen.
|
|
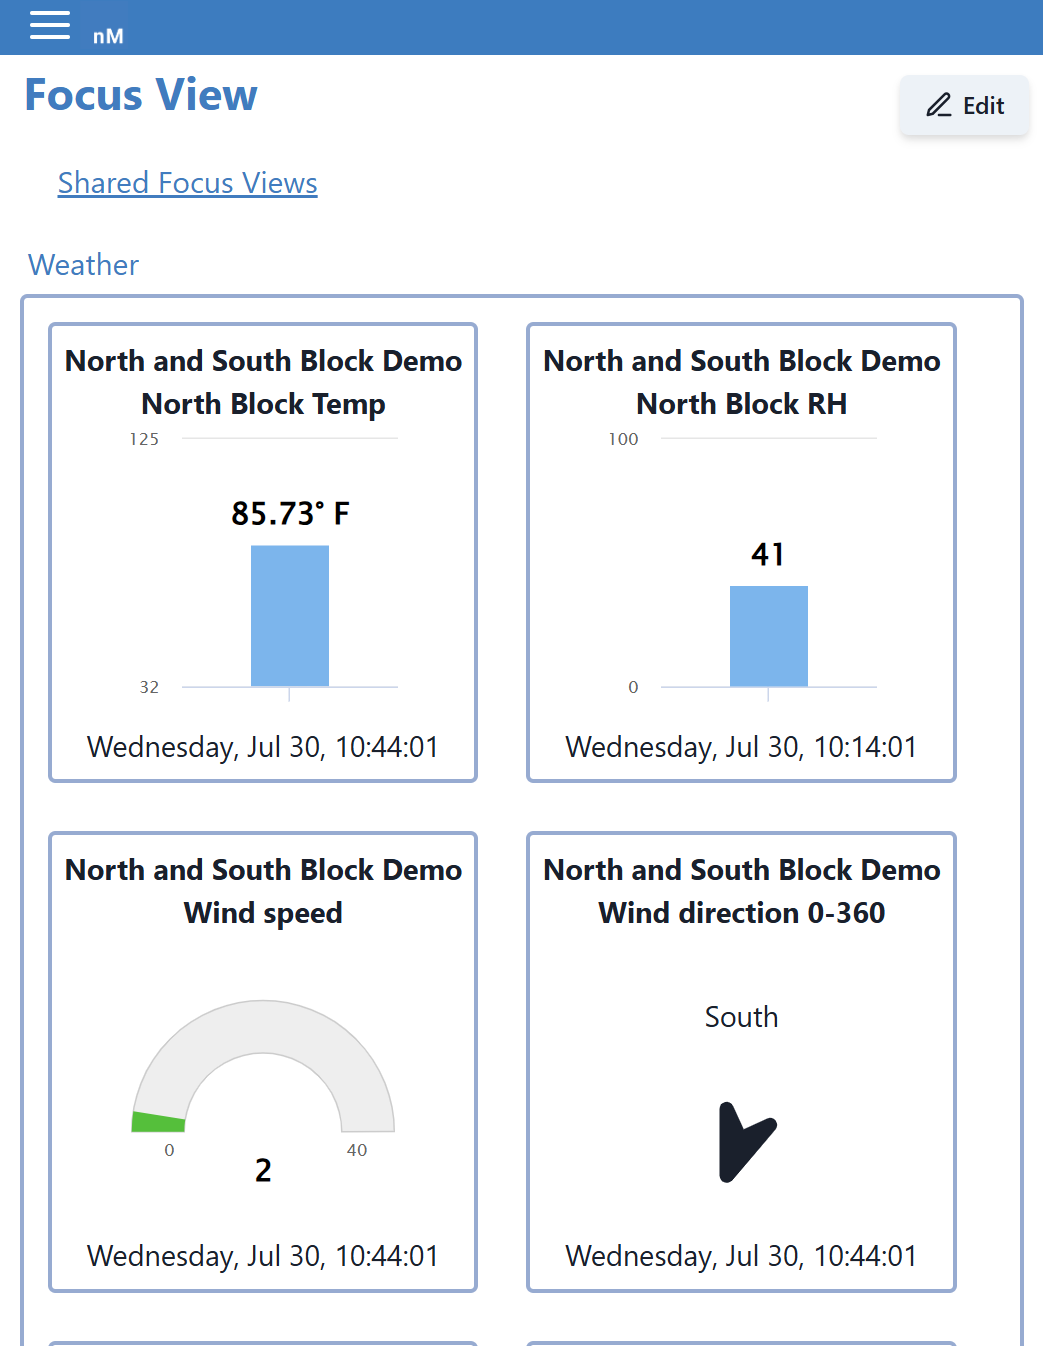
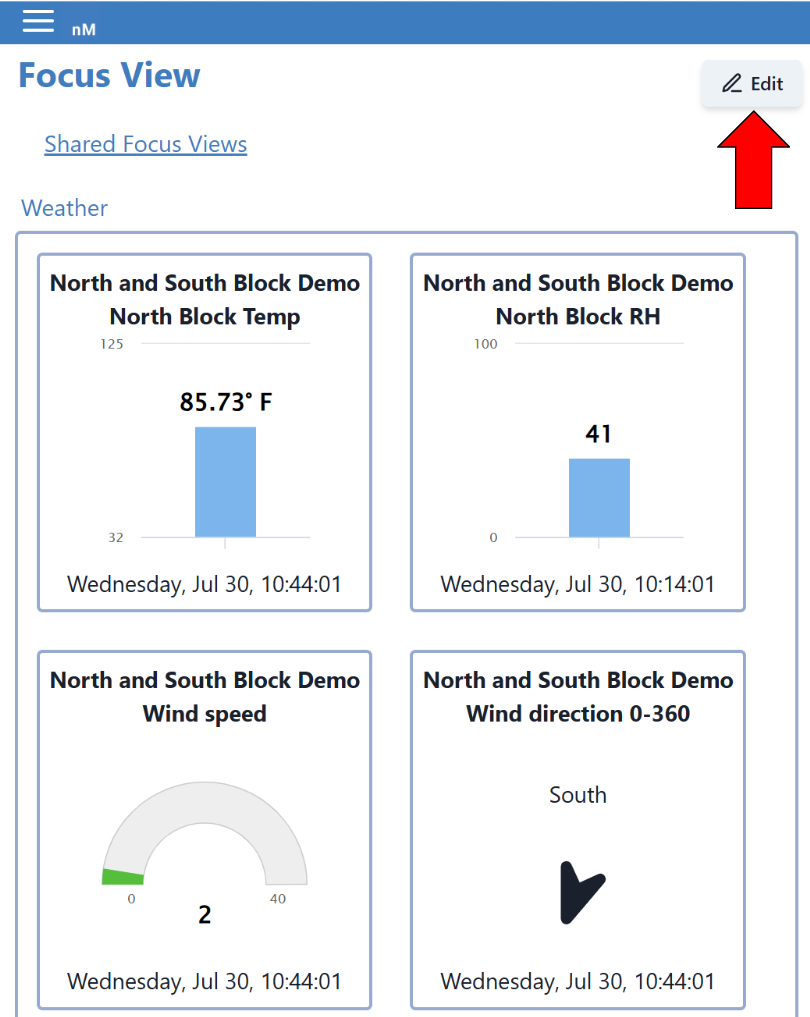
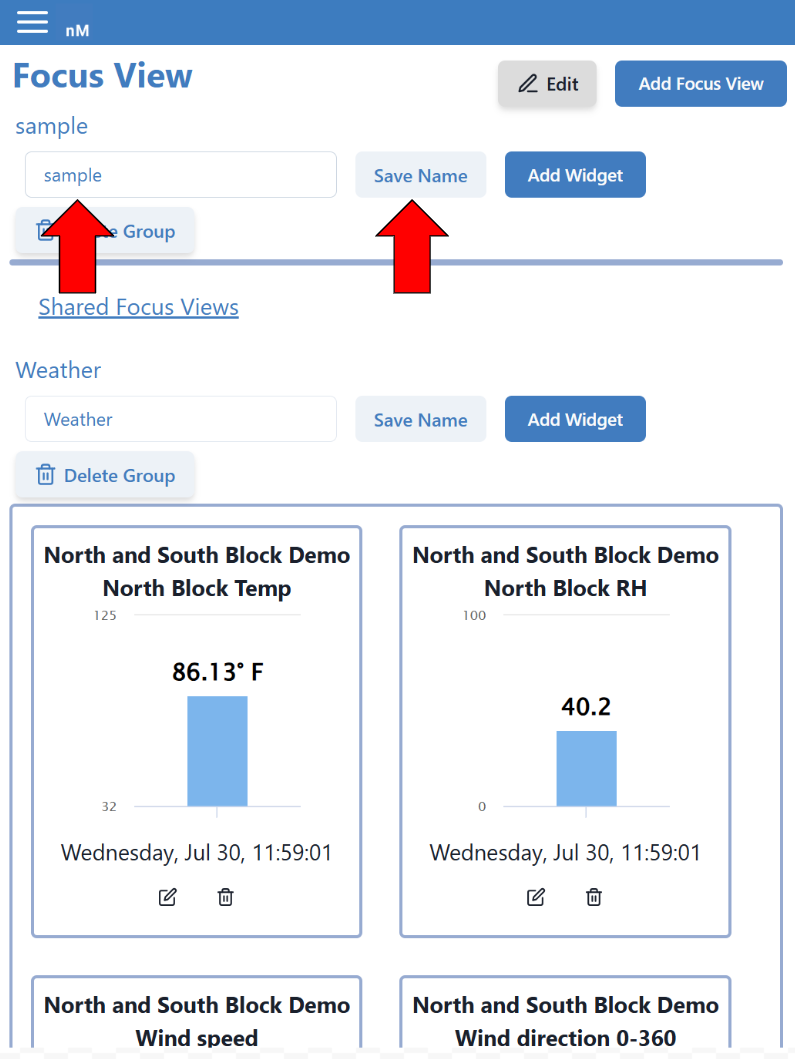
¶ Editing the Focus View Page
|
¶ Adding a Focus View
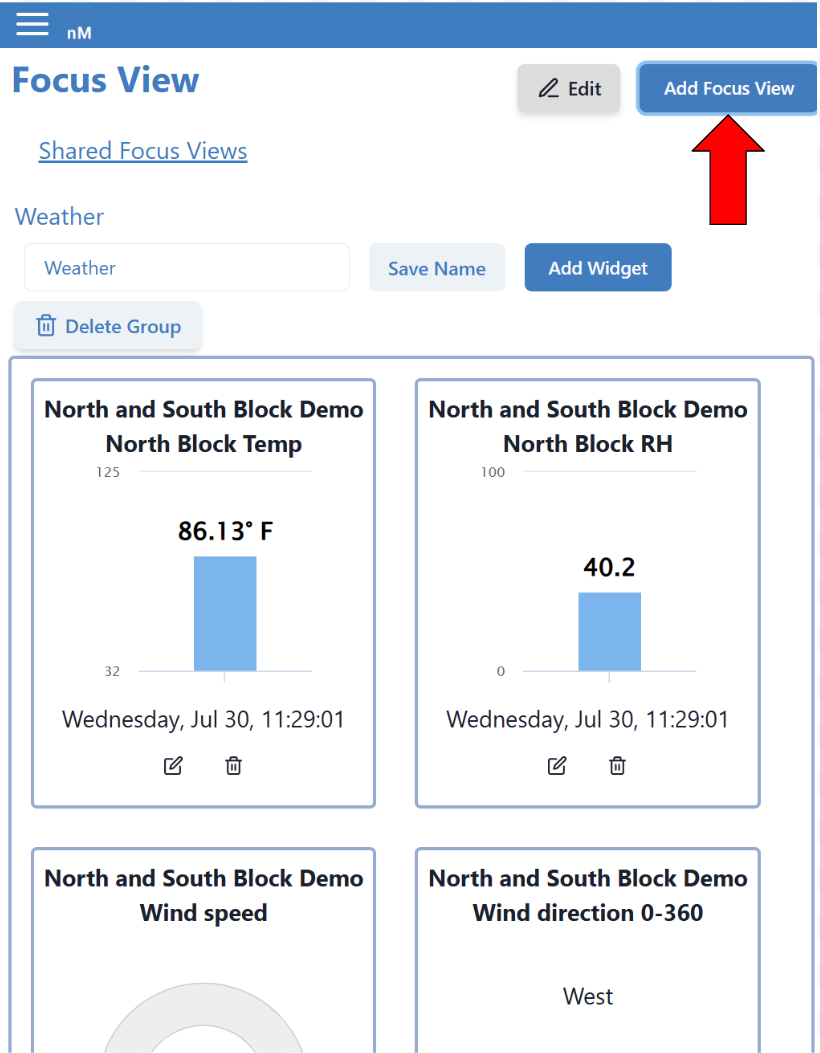
|
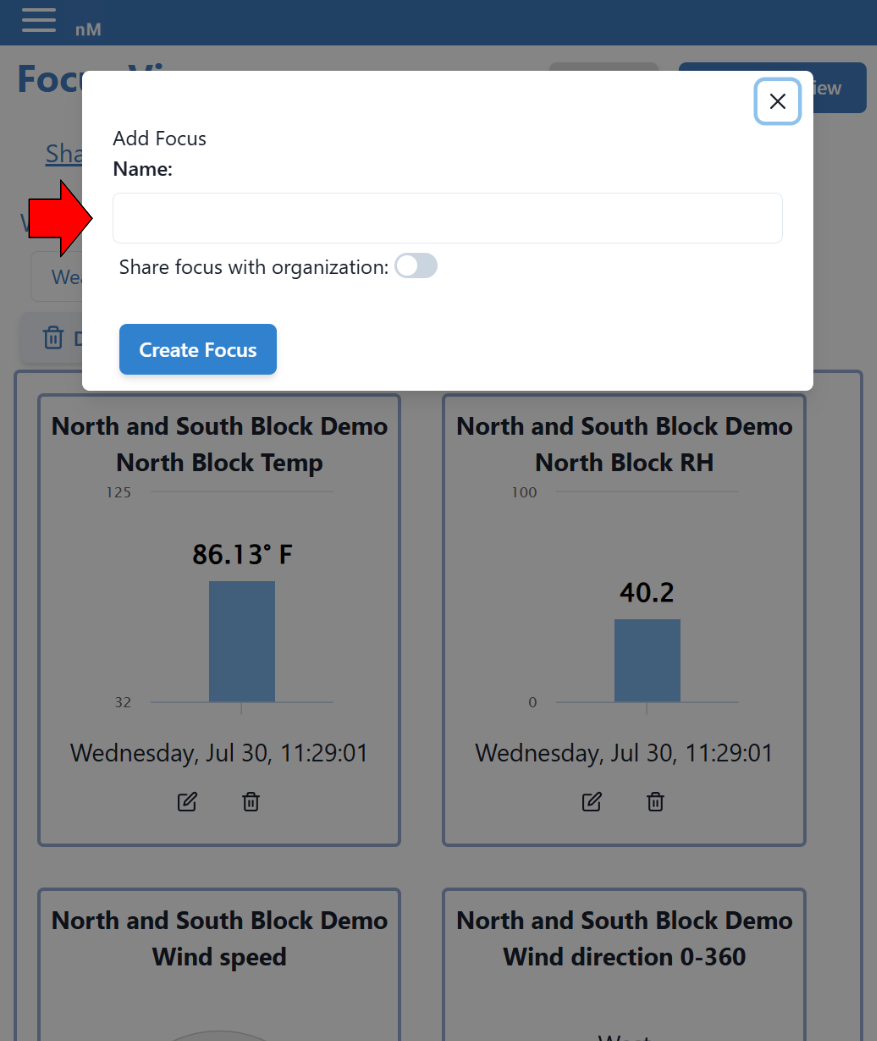
|
|
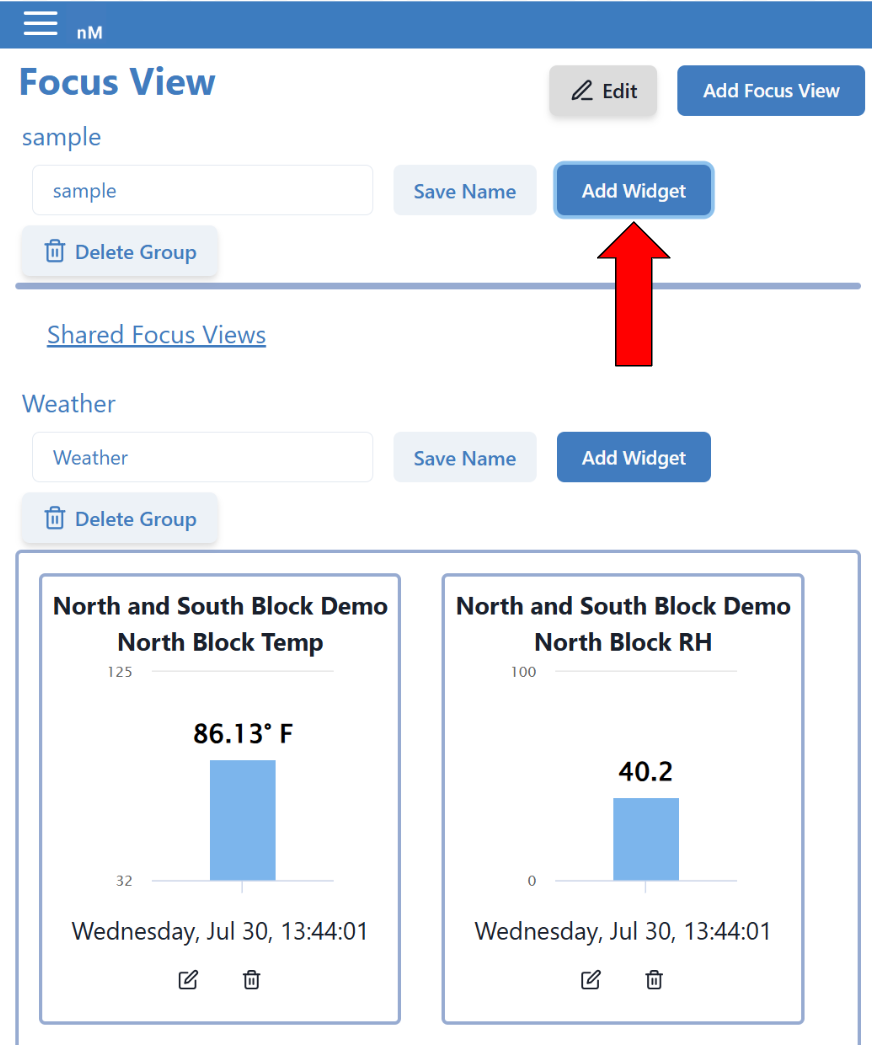
¶ Adding a Widget to Focus View
Adding a widget is arguably the most important step while working with a Focus View. Without an added widget, the Focus View will remain empty and won't have any data displayed.
|
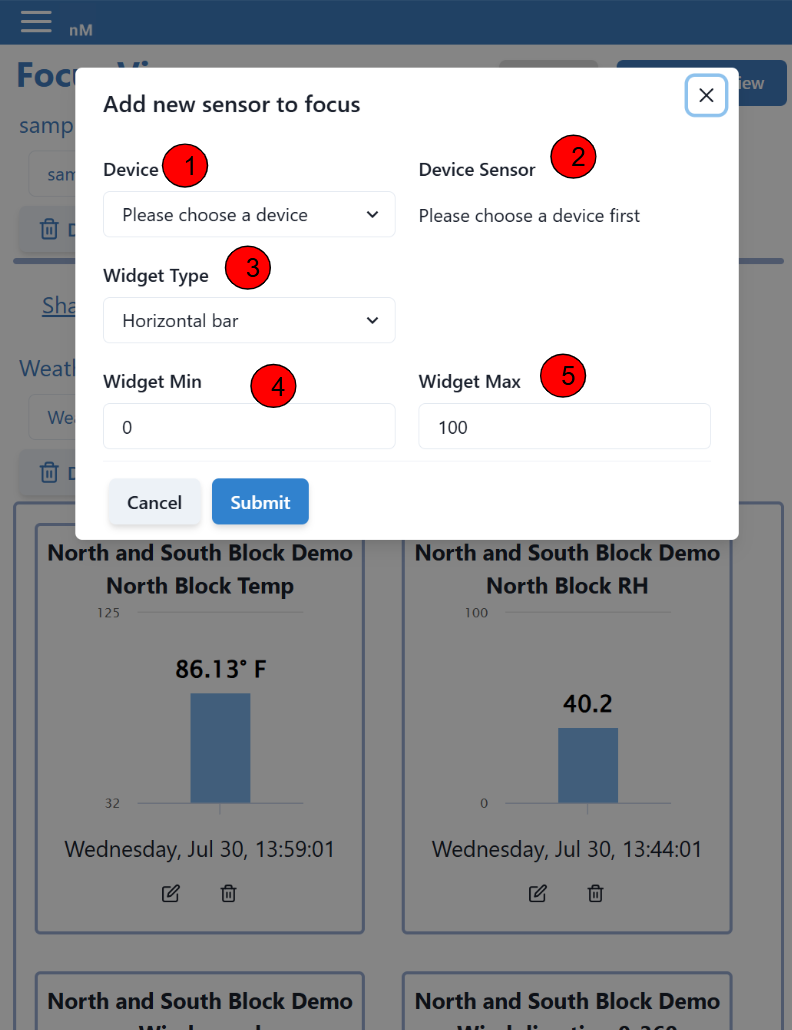 |
There are 5 sections to making a widget.
1. Choose the device/node your sensor is connected to.
2. Select the sensor you want to monitor and add to the Focus View.
Note: Once the widget is made steps 1-2 can not be changed, to replace a widget you must delete it first.
3. This is the graph that will display the data. It can be in the form of a gauge, horizontal bar, water tank, wind direction, and vertical bar. Below are the 5 displayed in order from left to right.
|
4. Each graph only displays data between two values. Enter the minimum value you want to capture. This can be negative or positive. By default this value is 0.
5. Each graph only displays data between two values. Enter the maximum value you want to capture. This can be negative or positive. By default this value is 100.
Note: If you're using a wind direction sensor the minimum and maximum value is automatically set from 0 - 360 and can not be changed.
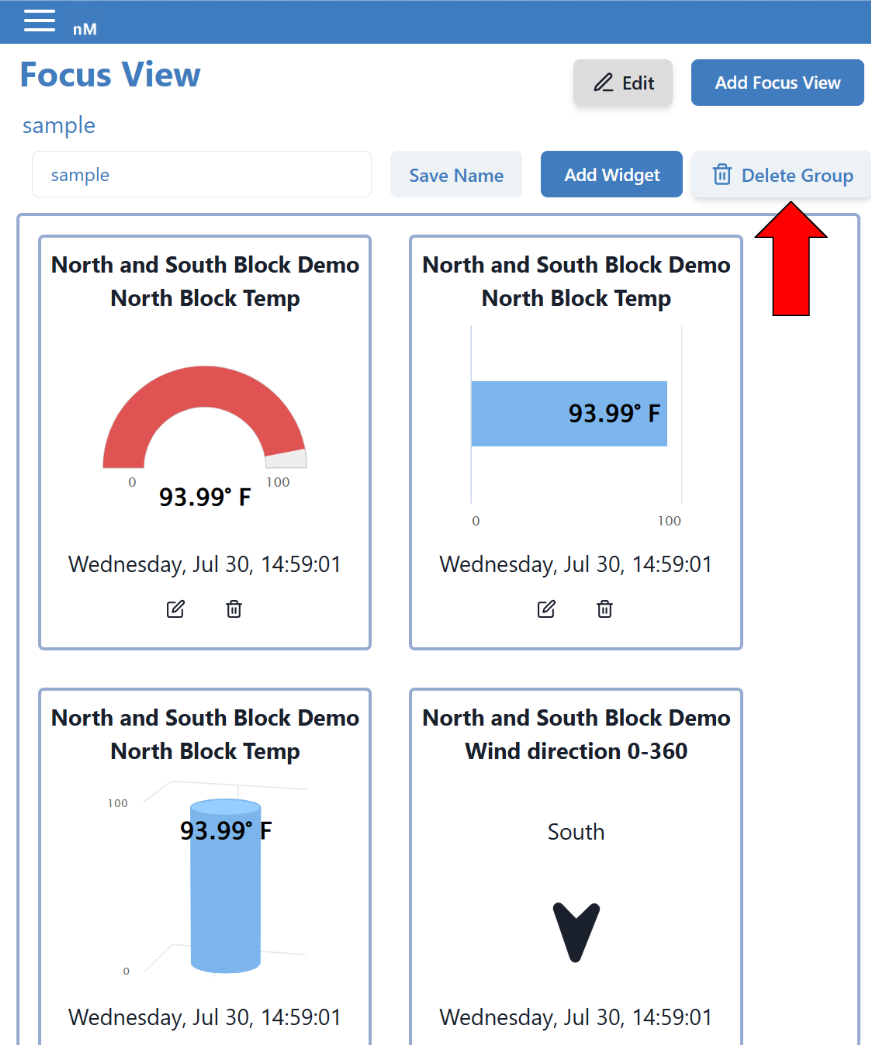
¶ Deleting a Focus View
|
Warning: Pressing Delete Group instantly deletes the Focus View and can not be recovered.