¶ Custom Views Guide
¶ Overview
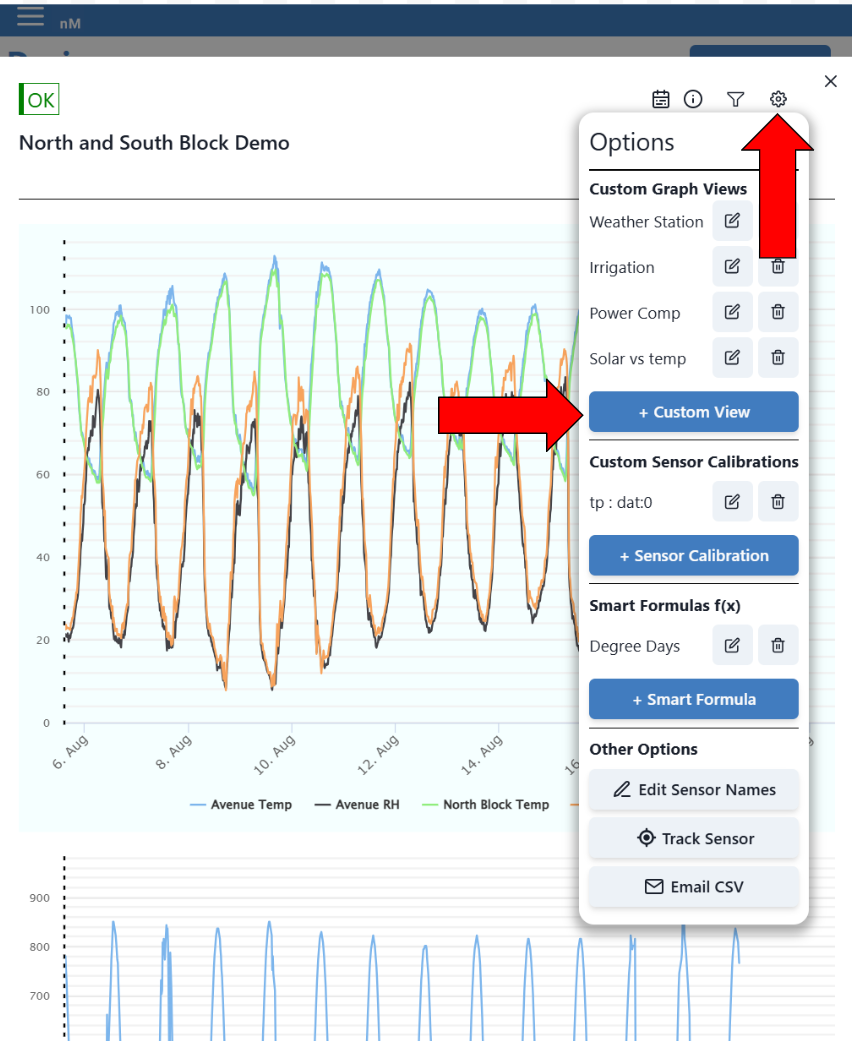
Custom Views are used to organize graphs together. By default, the graph view will display both Sensor Data and System Data, covered in the Viewing Graphs Page.
¶ Making a Custom View
|
|
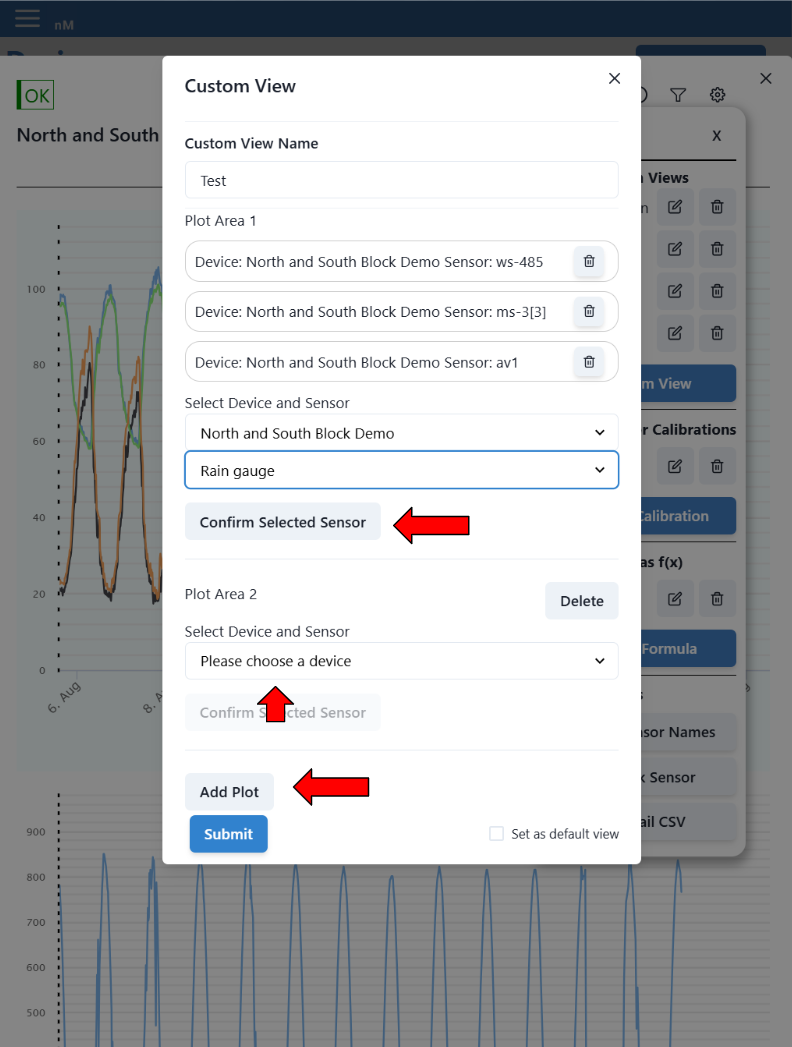
| Custom View Name | This is the name of the Custom View. |
| Plot Area | Each Plot links to a graph and can have multiple sensors placed on it, much like the image of the graph above. |
| Confirm Selected Sensor | Once a sensor has been chosen, press Confirm Selected Sensor to add the sensor to the plot. Then change the selection to add another sensor and press Confirm Selected Sensor again. |
| Add Plot | To have multiple graphs, click on Add Plot to add another graph. |
| Set as Default View | When entering a Graph View, by default you will see every graph available including System Data which won't be as helpful as Sensor Data. By selecting this box, next time when logging into the neatMon Hub and navigating to this device's graph, the Custom View will pop up automatically. |
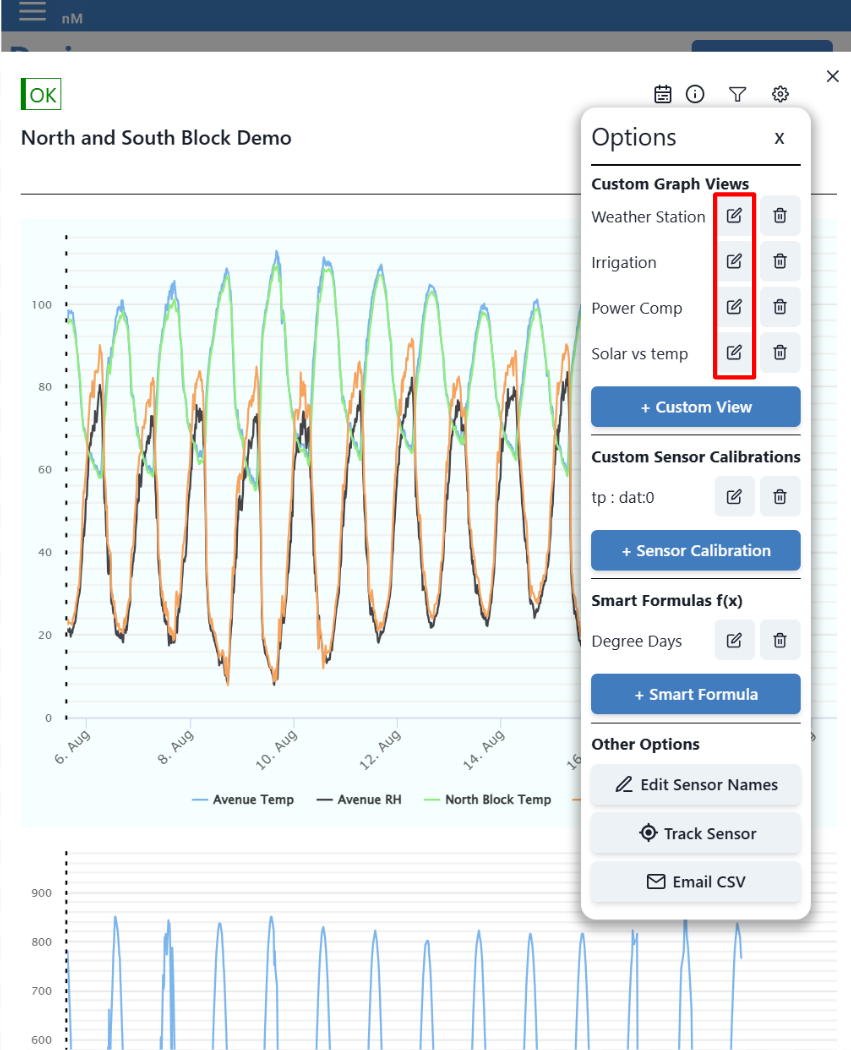
¶ Editing a Custom View
|
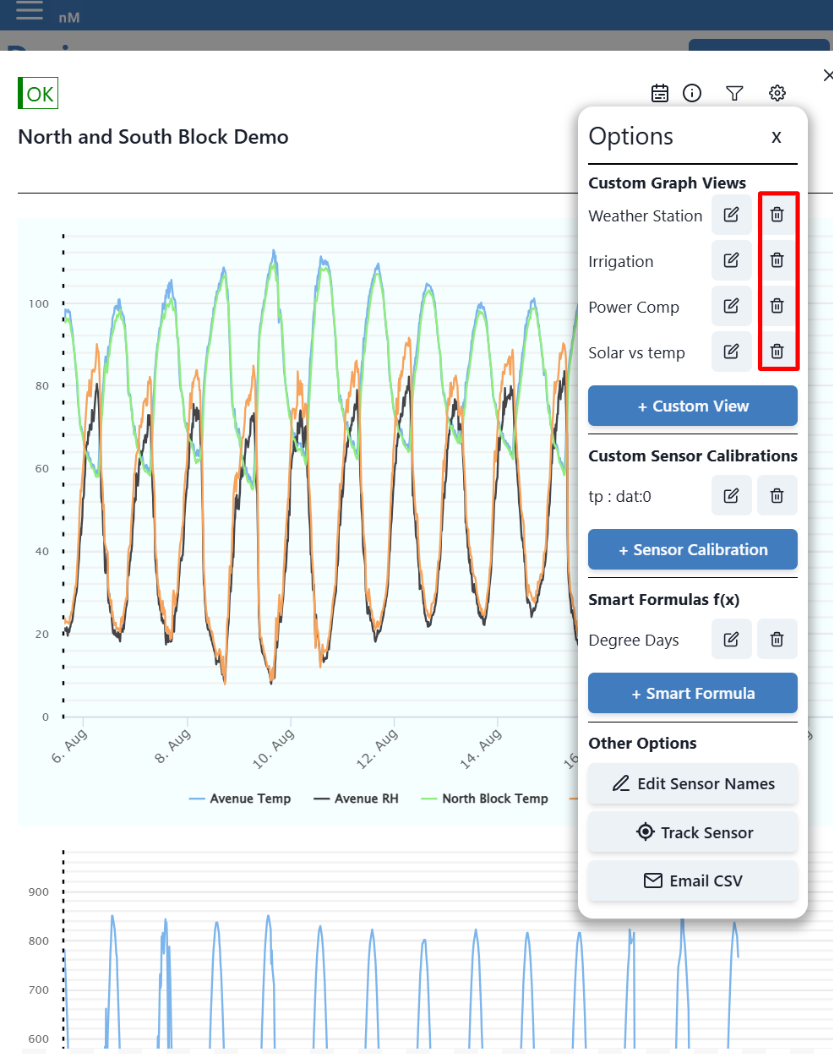
¶ Deleting a Custom View
|
WARNING: There is no prompt to confirm your deletion. Be careful when selecting the right Custom View to delete.