¶ Viewing Data On Graphs
¶ Overview
This guide is to help interpret graph data found in the Devices Page Guide and the Map Page Guide, including System Data and Sensor Data.
¶ Different Types of Data
There are two different types of data shown on the graphs. One is System Data and the other is Sensor Data.
System Data is data automatically collected by the device to track its health while Sensor Data is the data the system tracks for you. This data includes pressure sensors, moisture sensors, and others.
¶ Overview - Graphs
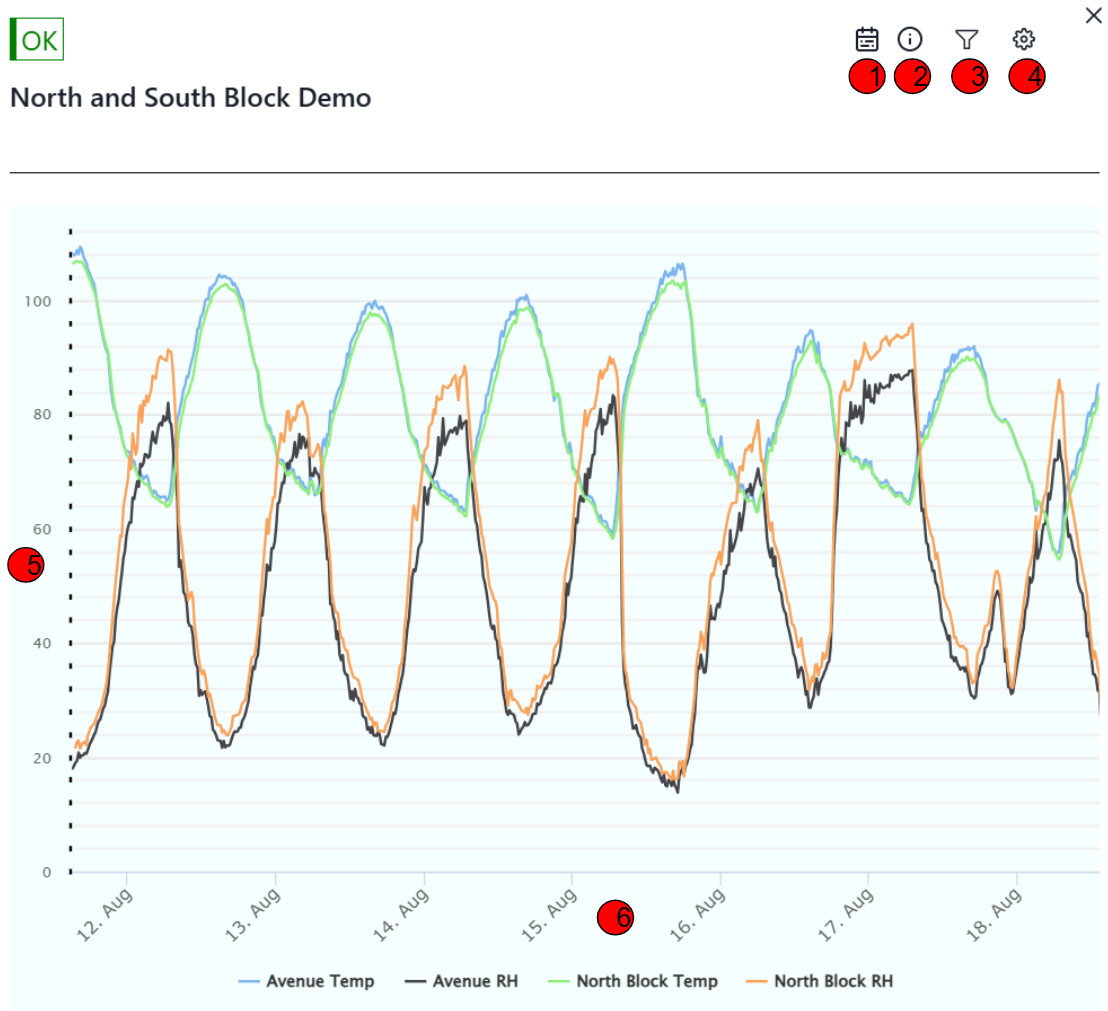 |
| 1. | Range of Time |
The calendar icon helps change the length of time the current graph is displaying. Clicking on it will give you several quick options such as Now, Last Week, Last Month, and Last Year. For a deep look, choose the Last Month option to get a good overview of how the sensors are behaving. Additionally at the top of the pop up there is a way to enter in a Custom Date Range to focus on a specific length of time you are curious about. |
| 2. | Device Information | Clicking on the exclamation mark icon brings up the Device Information. This includes the Serial Number, Organization, and the Time and Date of the Latest Data received from the Device. |
| 3. | Filter/Views |
Clicking on the Filter Icon will bring a pop up displaying the Custom Views made in the Configuration tab. This will let you switch between a specific view to focus on. Examples would be a view focused on soil moisture or water flow. At the top of the pop up is a Show All button. This will let you see every graph of data sent by the device. This includes both System Data and Sensor Data. Typically a Custom View will stick to only displaying Sensor Data. |
| 4. | Configuration | The Gear Icon will bring up a menu to configure your Custom Views as well as a place to enter in last minute calibrations that couldn't be made on the field. |
| 5. | Value | This is the value of the data at a specific height. |
| 6. | Time | This shows the date the data was collected on. Hovering over the data will additionally give the time the data was collected and the exact value. This part of the graph also shows what each color of line is tracking. In this example the blue line tracks Avenue Temperature, the black line tracks Avenue Humidity, etc etc. |
¶ Viewing System Data
System data is one of the easiest ways to debug issues with your node. If readings are missing, such as blank graphs or no values shown, please refer to sensor data. If sensor data is still being transmitted to the servers, then there might not be anything you need to change; however please contact support at info@neatmon.com to get the issue resolved and all your data working.
Note: If you are using Line Power, the graphs will look more flat. This is not a cause for concern, line power is more consistent with the power it brings in while Solar Power is more varied in strength.
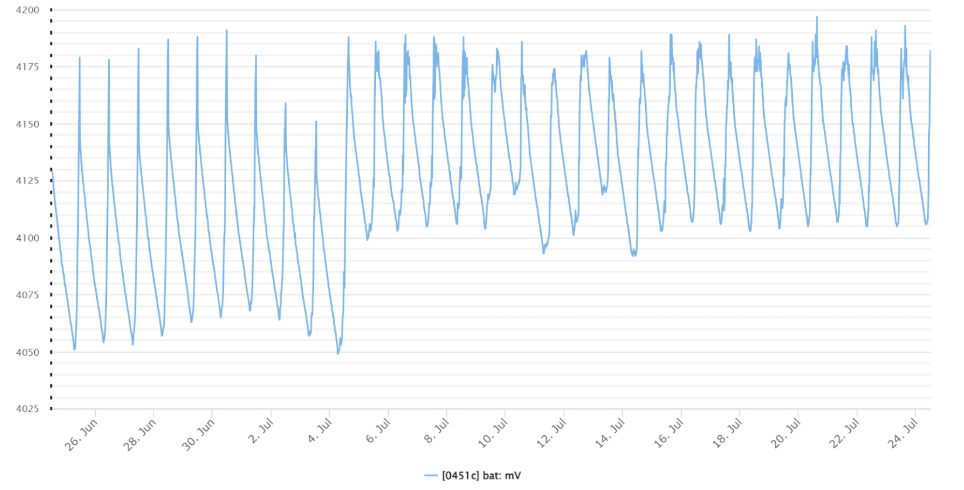
¶ Battery - Voltage
This is the voltage the battery is producing and uses for sensors. Make sure this number is higher than 4000 and/or is following a consistent recharge schedule.
Note: Keep track of where the peaks and troughs are. Solar powered nodes will have a consistent schedule, if this schedule is broken it can indicate the panel has been turned the wrong direction or messed with.
Good reading:
- Over 3800 mV. Expect less charging during the winter and more in the summer if you’re using solar.
- For line power expect 4100 - 4200 mV. If it gets below that amount there could be something wrong with the firmware or with your cable/power line.
- Consistent peaks and troughs
|
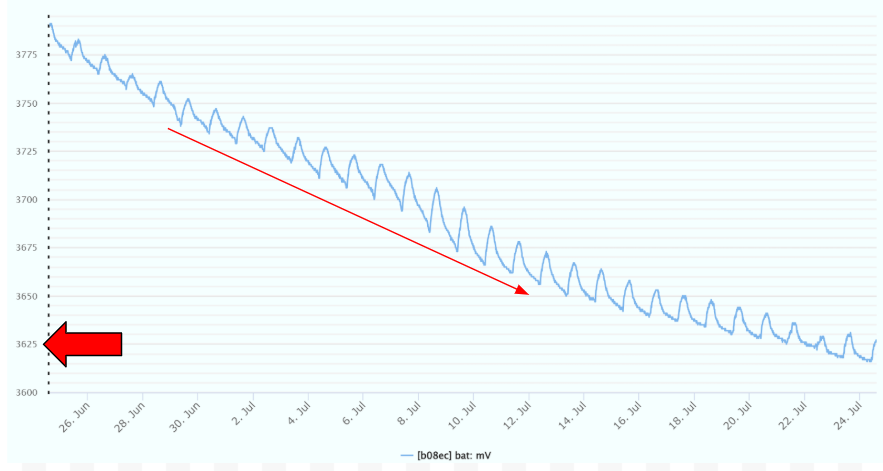
Bad reading:
- Below 3600 mV
- Consistent downward trend
- This means the battery is not charging properly. Very likely there is a blockage on the solar panel. The battery is still following its schedule, charging at 8am and peaking at 5pm but it isn’t charging all the way. This means the solar panel isn’t strong enough and isn’t giving enough charge to the battery.
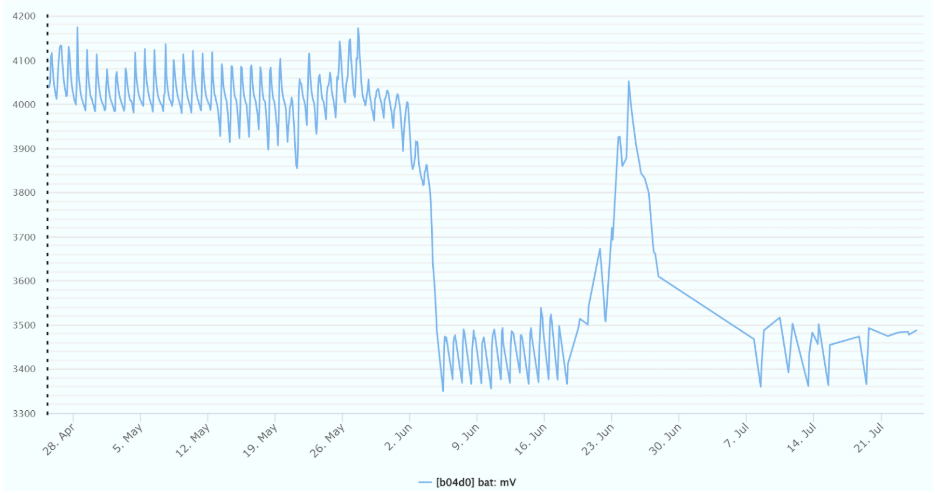
- Jittery/blocky readings, 2nd image shown.
- This means the battery has died. It cannot build up enough charge to consistently send data. Check solar panel faces and connected wires.
|
Note: when the battery gets below 3600 mV and the capacity is below about 500 it is effectively dead and system data (voltage, amperage, bytes) will no longer be smooth but instead blocky. Hopefully sensor data will not be blocky since while the battery is dead, the node will store sensor data until it gets enough charge to send the data to the servers all at once.
|
¶ Battery - Amperage
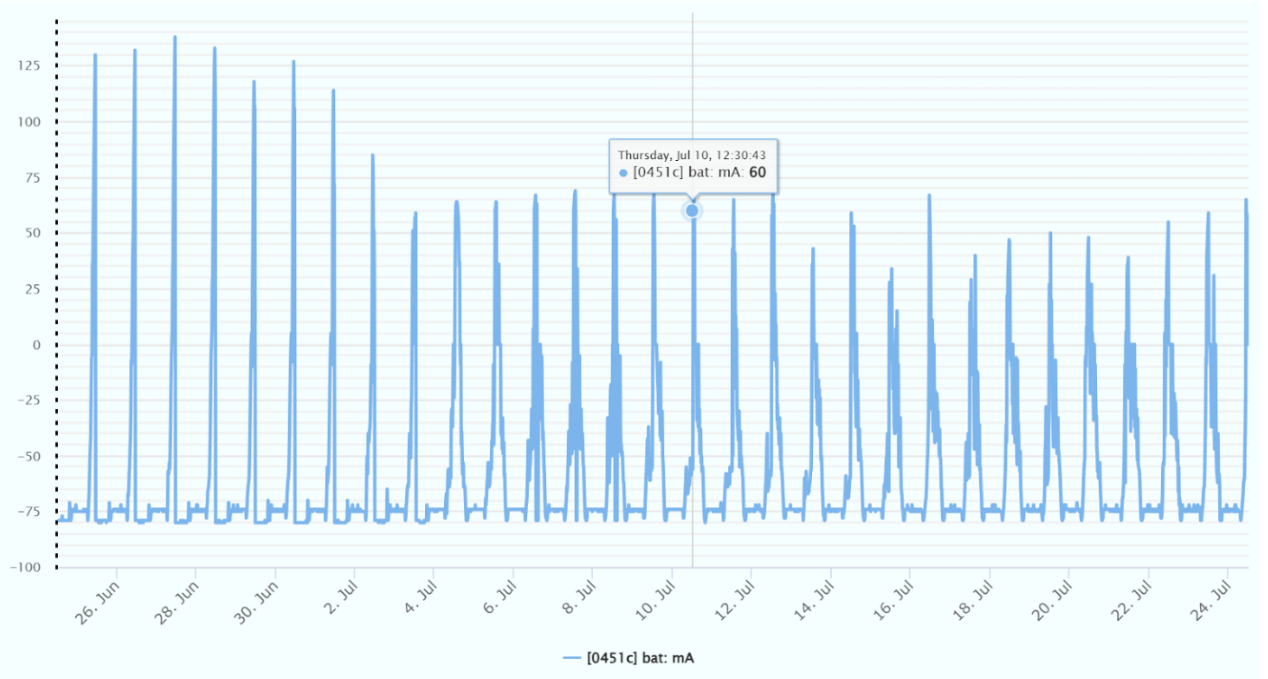
Looking at bat: mA
- This is the amperage/current running through the battery. Positive reading means charge is being added to the battery, negative means the battery is being used/drained.
Good reading:
- Peak and troughs of both negative and positive values.
- Not entirely negative/not entirely positive. Entirely negative means the battery is not charging.
|
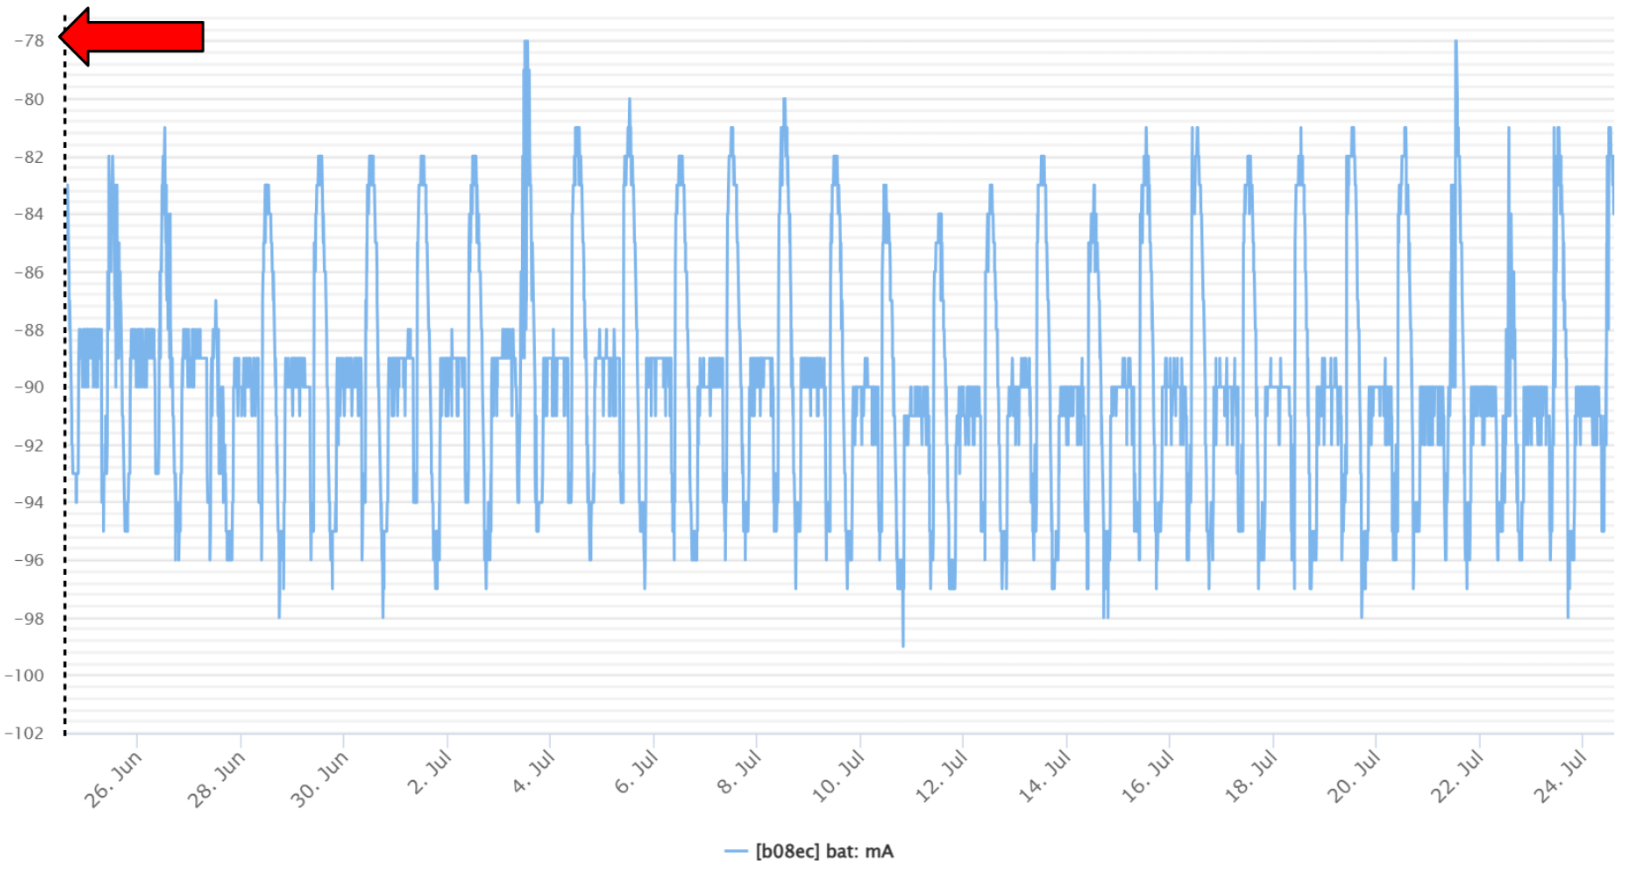
Bad reading:
- Consistently below 0 means the battery isn’t charging and is only getting drained.
- Check solar panels and/or connected wires.
- If only the amperage is negative but the battery voltage is still high, don’t change anything. This could be an error with the amperage sensor which is not a critical component.
|
¶ Battery - Capacity
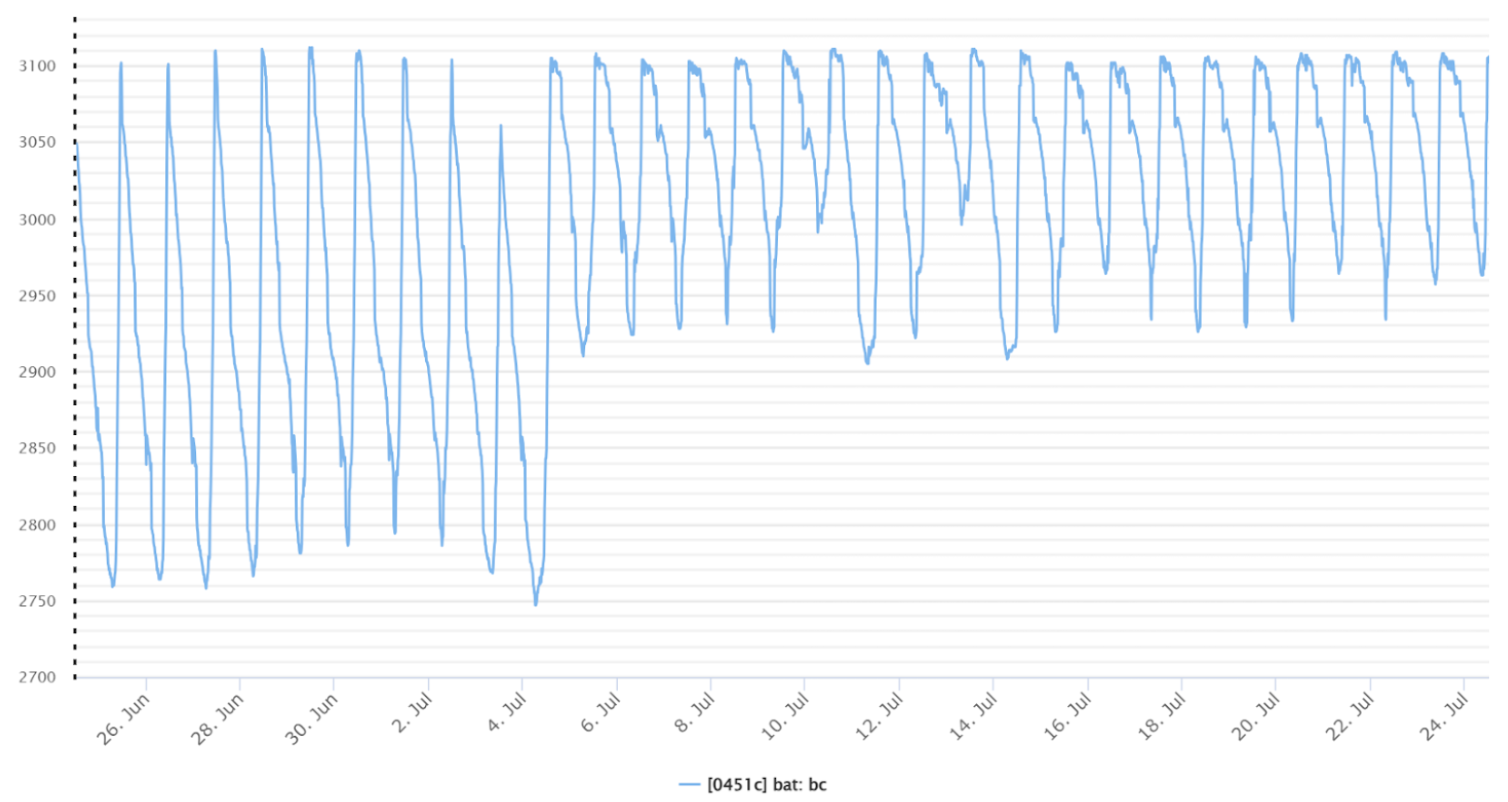
Looking at bat: bc
This is the capacity of the battery. Make sure this number is above 1000. The capacity is how much charge the battery has stored on it. For sending data, capacity is a must have. Reading sensor data and storing it does not require a battery but connecting to the servers does. Once below 100 capacity, the battery is dead and will enter a reboot cycle making the capacity drop below 100 again, shutting the node down and starting the cycle all over again.
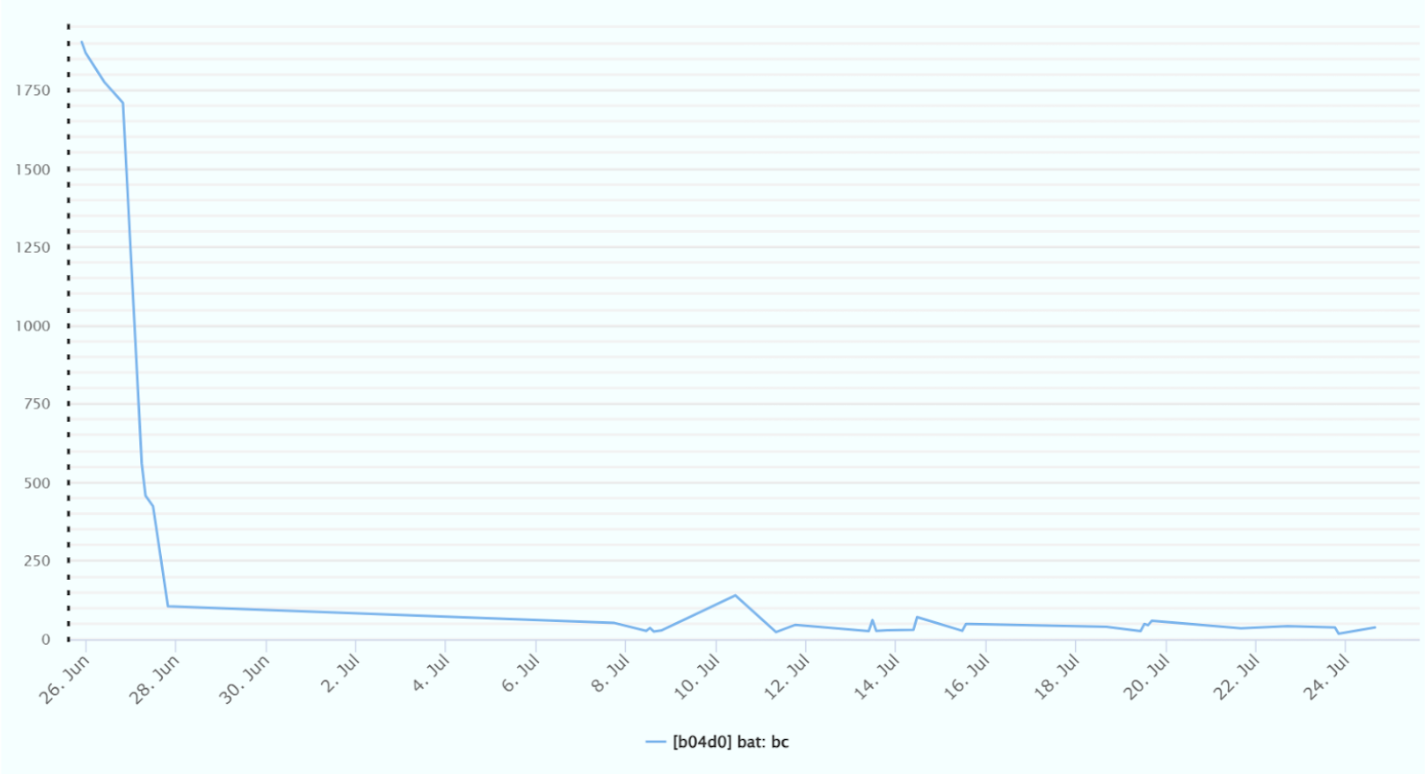
If there is nothing plugged into the node or the node were to be disconnected, the charge of the battery will experience a sharp decline caused by the node pulling charge from the battery instead of the power source or outlet.
Should be similar to the bat: mV reading.
Good reading:
- Consistent reporting/no breaks
- Consistent pattern that is similar to the mV reading.
- Above 2000
|
Bad reading:
- Sharp decline
- Consistently below 1000
|
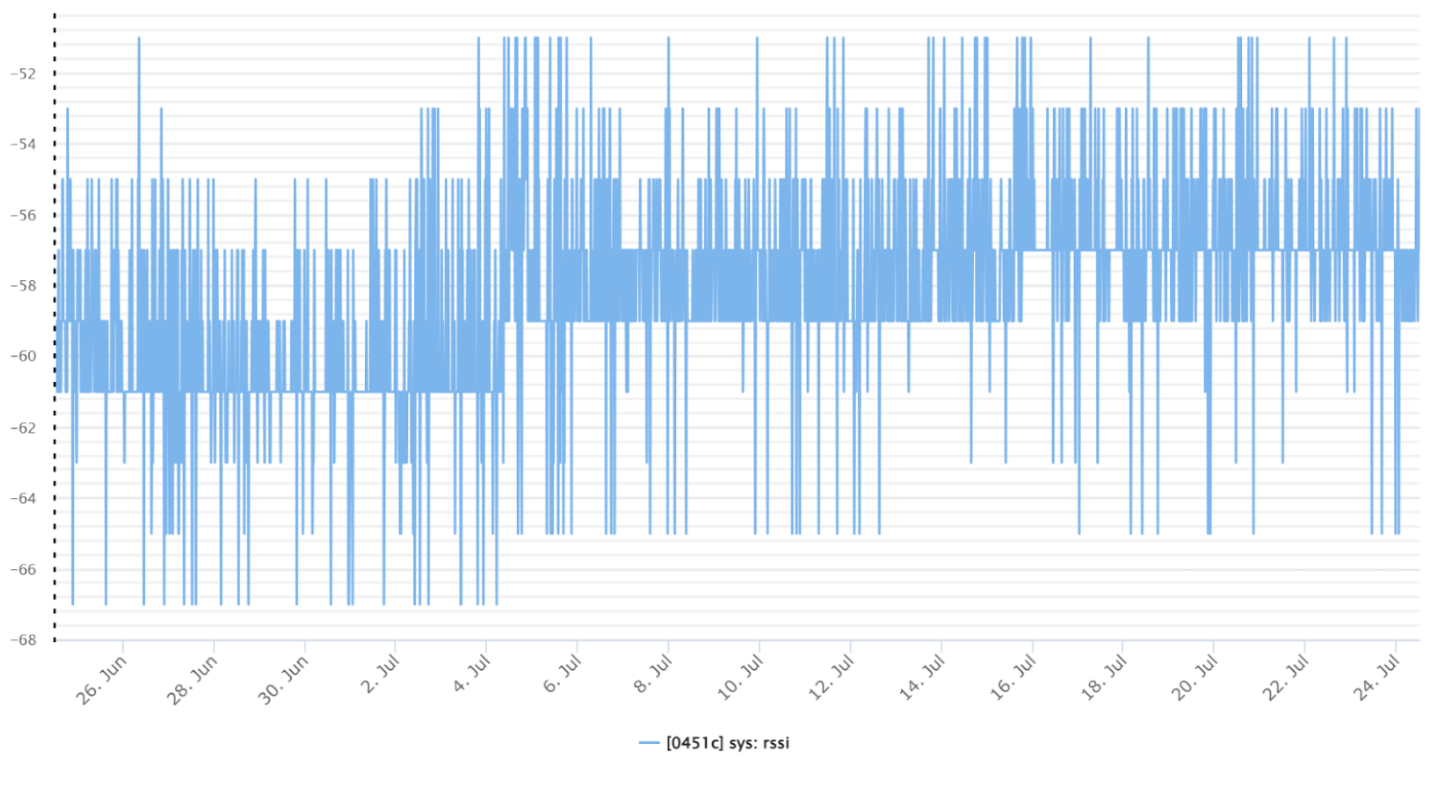
¶ System - Signal Strength
Looking at sys: rssi
This is the signal strength of the node.
This should be above -80, the closer to 0 it is the better. At around -90 to -100, there is very little signal strength and could be an indicator of bad node placement or bad Wi-Fi signal.
Note: All RSSI readings are in the negatives. Make sure there is no confusion in its reading.
Good reading:
- Above -80
|
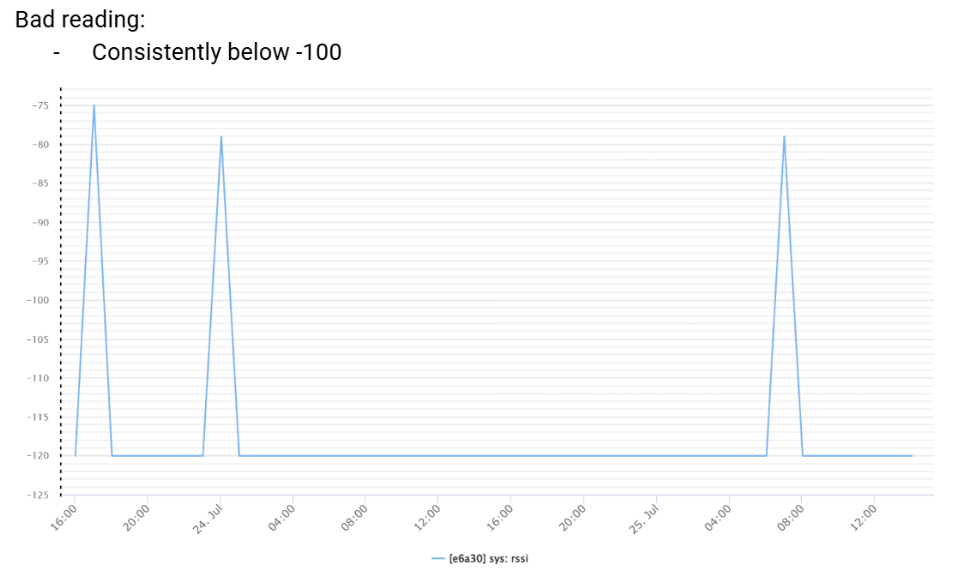
Bad reading:
- Consistently below -100
|
Note: Occasional spikes to exactly the value -120 or even frequent spikes to -120 are expected. This is because if the sensor can’t pick up an rssi value it gives the lowest number it can: -120. Only if your node has rssi values between -120 and -100 consistently should you look into either your Wi-Fi connection, clearing the surrounding area of the node, or contacting support at info@neatmon.com.
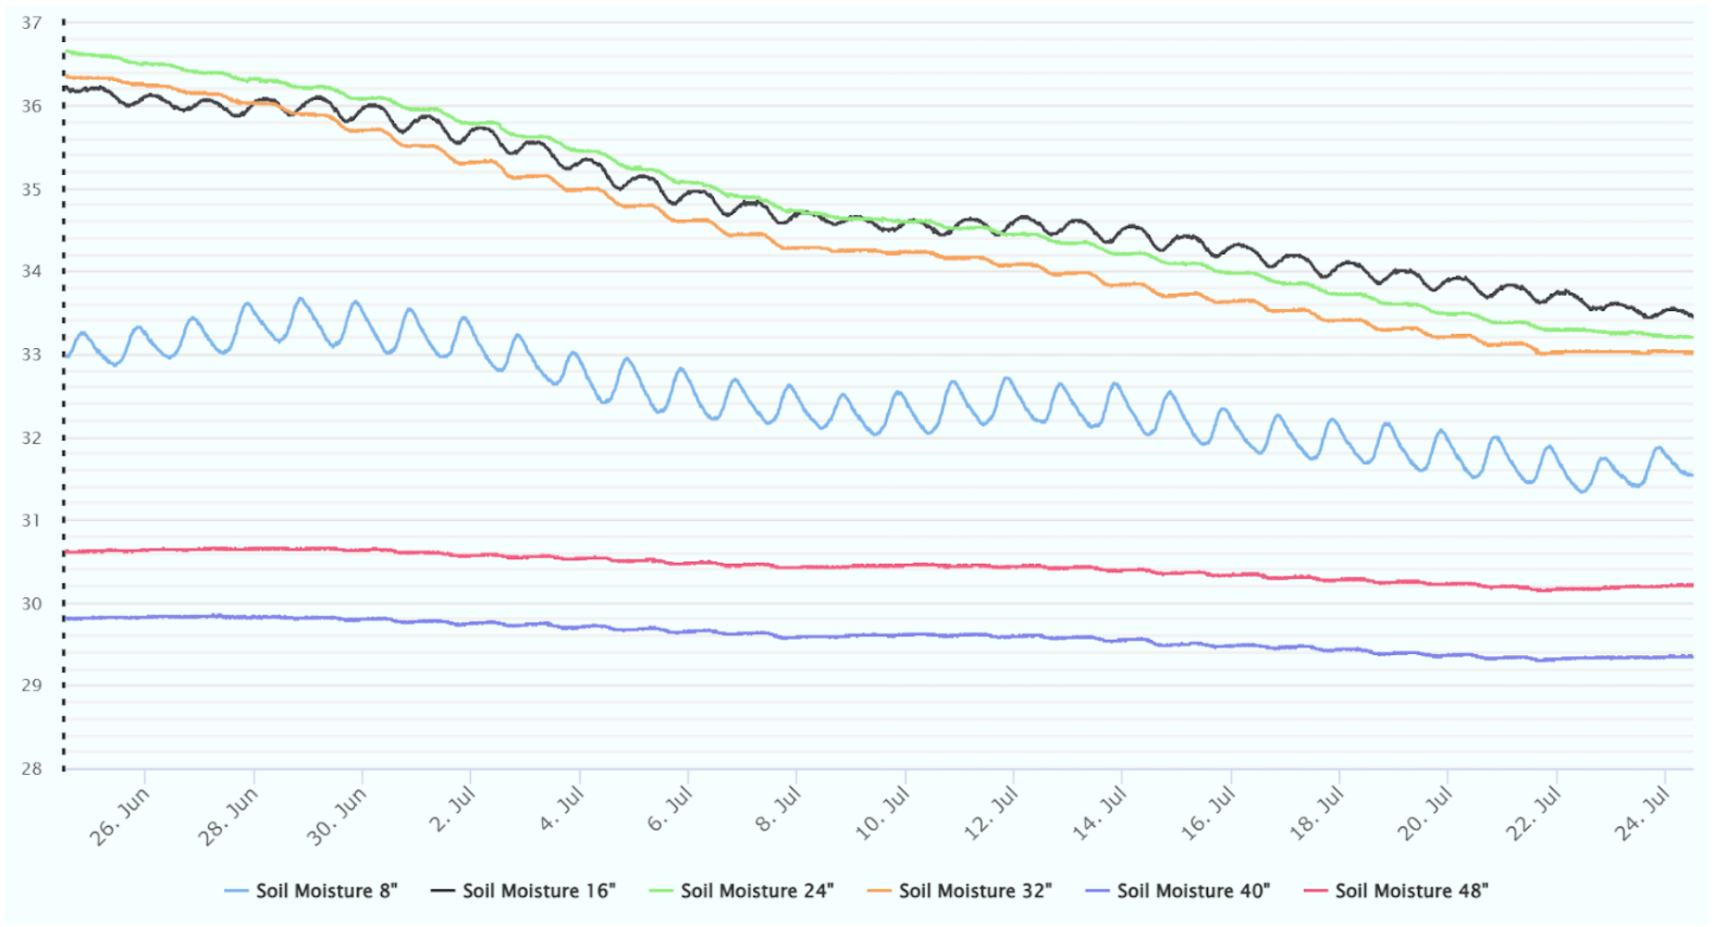
¶ Viewing Sensor Data
WARNING: Depending on the sensors you have, these might not be good indicators. Looking for breaks in patterns, values that are too low or too high, and missing data is a good place to start.
Good Data:
- No breaks in data
- Consistent patterns
- No extraordinary readings/spikes/pits
|
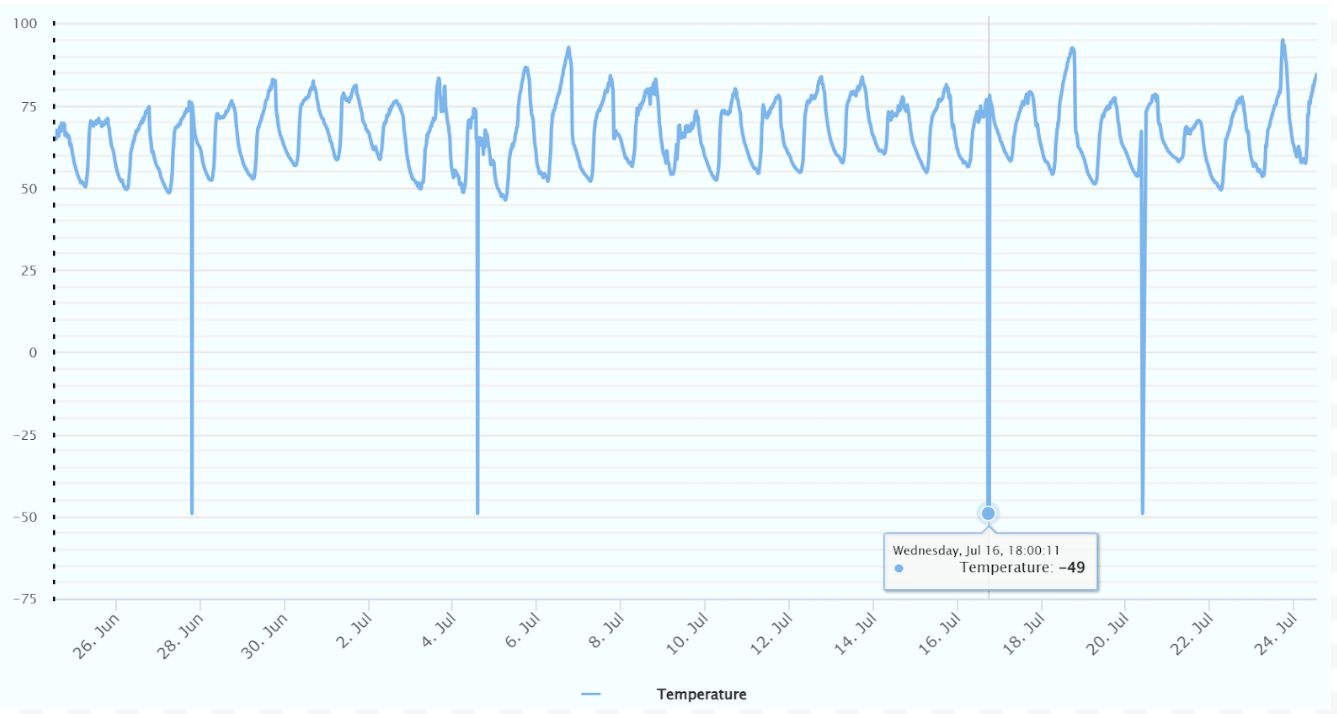
Strange Data:
- Random Spikes in otherwise predictable data
- The spikes all go to the same value (in this case -49). This indicates a sensor issue. Some sensors will output a number outside their voltage rating. For example a 4-20 mV sensor might output a voltage of -1 mV to show that it wasn’t able to pick up a reading, as is the case here.
- If data is blocky and only has 2 points of data in 2 days, something is most likely wrong with your node. This could be due to incorrect sensor configurations, bad signal, or lack of storage on the node.
|
Note: This guide isn't meant to make assumptions about what the data is saying. This guide is an overview of what could be wrong if a disruption is occurring with any sensors on the device. For further help contact support at info@neatmon.com