¶ Overview
The Automated Monitoring Nodes (AMN) can accept third-party sensors that output current such as 4-20mA. Additionally, the AMN-PLUS has two discrete analog inputs that can accept current sensors as well.
Many sensors use the 4-20mA signal including some pressure sensors, analog temperature sensors, submersible level sensors, non-contact level sensors, and many others.
Please confirm with neatMon or your sensor supplier what type of sensor you have. A 0-5v analog voltage sensor, for example, requires different wiring and firmware configurations from the current loop sensor guide shown here.
¶ Getting Started
¶ Installation
A current sensor typically consists of a two-wire output. There are a few exceptions, where the power to the sensor is separated and this will be described below as well.
- Determine what wires output the value in current (mA) from the sensor
- Most sensors will have two wires or three wires, identify the wire and purpose and note the polarity of each wire
- Using the table below, connect the wires to the desired sensor port and power port
- Finally, connect a jumper to the corresponding jumper pins as shown in the table and photos below
¶ Current Sensor Wiring
2-Wire:
| Sensor Wire Name | Purpose | nM Port |
| “Signal” or "Output" or "Return" or “GROUND” (Typically Black Wire) | Output the sensor status in mA | Any GPIO (All Units) or A1/A2 ports (AMN-PLUS only) |
| "Power +" or "Supply V+" or “VCC” or “VDC+” (Typically Red Wire) | Provides power to sensor (make sure to connect to the power specified by the sensor manufacturer). |
12v+ (Typically 12vdc for 4-20mA sensors, refer to sensor manufacturer documentation as some sensors may have different requirements. Contact neatMon support if 12vdc is not specified) |
3-Wire:
| Sensor Wire Name | Purpose | nM Port |
| "Signal" or "Output" | Output the sensor status in mA | Any GPIO (All Units) or A1/A2 ports (AMN-PLUS only) |
| GND | Ground | GND |
| "Power +" or "Supply V+" (Typically Red Wire) | Provides power to sensor (make sure to connect to the power specified by the sensor manufacturer). |
12v+ (Typically 12vdc for 4-20mA sensors, refer to sensor manufacturer documentation as some sensors may have different requirements. Contact neatMon support if 12vdc is not specified) |
¶ AMN-PLUS Jumper Configurator
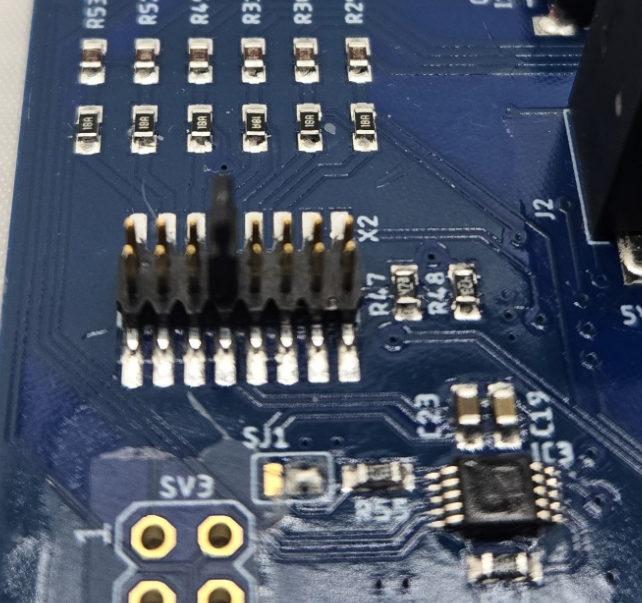 |
| Insert the jumper into the corresponding position as detailed in the table below (this is the port that the signal/output wire is landed on). The example above is selecting GPIO3 for the AMN-PLUS |
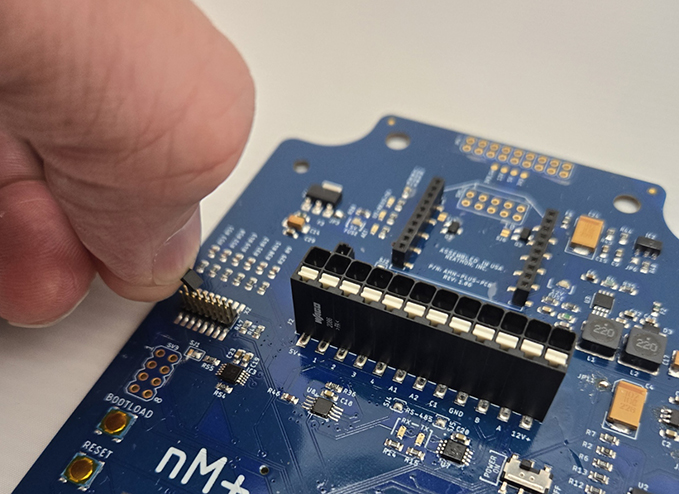 |
| Locate the jumper block on the edge of the board. Use the table below to determine which set of pins to place the jumper onto. Ensure that the jumper is connected to both pins. |
Note: Ignore far-right jumpers, they are used to configure the counter (e.g. Rain Gauge or Flow Meter).
| A2 | A1 | GPIO4 | GPIO3 | GPIO2 | GPIO1 | ||
| A2 | A1 | GPIO4 | GPIO3 | GPIO2 | GPIO1 |
¶ Configuration
¶ Get Prompt
First, you will need to open a serial terminal to the AMN and arrive at the NeatMon Main Menu. If you are unsure how to do this check the Opening Serial Terminal guide.
NeatMon Main Menu
        1: Network config
        2: Sensor config
        3: Utilities
        x: < Save & Quit

>2Choose Sensor config by pressing 2.
¶ Select sensor
Sensor Config
        1: Add sensor
        2: Disable Battery monitor
        3: List sensors
        4: Delete sensor
        5: Test read
        x: <Back

>1Choose Add sensor by pressing 1.
¶ Configure Sensor
¶ Add sensor
Create sensor

Select type:
        1: nM TPRH sensor
        2: nM NCTP sensor
        3: nM GPIO analog (4v max)
        4: nM digital counter
        5: nM air quality monitor
        6: Generic SDI-12 Sensor
        7: Sentek RS485 SM
        8: LeafMon sensor
        9: Next page....
        x: <Back

>9

NOTE: YOU MAY ALSO SELECT "3" for nM GPIO analog (4v) IF DESIRED, HOWEVER A1/A2 (Next page...) IS RECOMMENDED.

Sensor list continued...
Select type:
        1: nM+ A1/A2 analog (5v max)
        2: Relay Controller - 8 Relay
        3: Relay Controller - RS485
        4: Davis VP2 Weather Station - RS485
        5: High frequency kHz counter
        6: GPIO Pulse counter
        7: Modbus Sensor
        8: HD GPS (ZED-F9P)
        9: Next page....
        x: <Back to Sensor Menu

>1Choose either the nM GPIO analog (4v max) or nM+ A1/A2 analog (5v max) to begin configuring a new current loop sensor. For our example we will follow the nM+ A1/A2 analog (5v max) setup which is recommended given the wider measuring scale compared to the GPIO configuration.
¶ Configure sample rate
Enter sample rate (mins): 15Enter your desired sensor sample rate, 15 minutes is standard.
¶ Configure/Select port
Select nM Analog Port #:
  1. A1
  2. A2
>1Select the port that your “Signal” or “Output” wire will be connected to.
NOTE: Double check that your jumper is on the corresponding pins for the port you have selected, see “AMN-PLUS Jumper Configurator” above.
Select sensor type:
  1. Analog Sensor
  2. Current (mA) Sensor
>2Select Current (mA) Sensor
¶ Configure scaling
Determine if the scaling/calibration will reside on the AMN firmware or will be calibrated in front-end software at a later time. An advantage to calibrating in software later is that the analog value is retained and can be useful for debugging. An advantage to setting the calibration in the firmware is that it reports to the API already calibrated, saving an extra step later on.
For an example on calibration formulas please see this calibration worksheet
Select scaling option
        1. None (Raw)
        2. F(X)=MX+B
>2Select 2. F(X)=MX+B to apply calibration/scaling in the firmware.
Select 1. None (Raw) to measure and report raw voltage readings with no calibration/scaling.
Enter the minimum sensor value (e.g. 0 PSI): 0
Enter the maximum sensor value (e.g. 500 PSI): 100
Enter the minimum current (mA) output (e.g. 4 mA): 4
Enter the maximum current (mA) output (e.g. 20 mA): 20

Will use scaling:  F(X)= (0.0417)X + (-25.0000)
Values okay? (Y/n)
>YIf you selected 2. F(X)=MX+B, enter the parameters of your sensor. The example above is for a 0-100psi 4-20mA pressure sensor. Enter Y to accept the calculated values.
¶ Configure custom name
It is possible to provide a custom name to ‘tag’ data sent to the API. It is useful to know what sensor is connected. Provide a 3 character name
Change sensor name (av1)? (Y/n)
>Y
Enter new name (max 3 chars): psi
Set name: psi
¶ Configure excitation and read times
Enter excitation time in milliseconds (More than 10 mS) >500
Excitation time: 500ms. Is this correct? (Y/n) >Y

Enter read time in milliseconds (More than 10 mS) >500
Read time: 500. Is this correct? (Y/n) >Y
Set the excitation time and read time based on sensor manufacturer recommendations. If you do not know, or the manufacturer has not specified, 500ms for both is a good starting point.
Excitation time is the amount of milliseconds that the sensor is powered on prior to reading the measured values.
Read time is the amount of milliseconds that measured values will be read and collected after the power up time is reached. There are roughly 60 readings per second (5 readings in a 100ms read time, 30 readings in a 500ms read time, 60 readings in a 1000ms read time, etc.).
In the example above, the sensor will be powered up for 500ms, then remain powered for an additional 500ms during which the readings will be taken.
¶ Configure alert sample rate
Set an alert sample rate? (Y/n)
>YYou may set a different sample rate based on the measurement returned. For example, if you have a water line that is normally not pressurized, but when it is pressurized it should measure more frequently, you could set a faster sample rate when pressure above “x” psi is reached. To set up alert sample rates, enter Y. In most cases is it not necessary.
Set alert sample rate (minutes): 5
Next, set the sample rate you would like to apply once the threshold has been met. In the example above, the sensor would go from being sampled every 15 minutes (as configured in the "Configure sample rate" step above) to every 5 minutes if a reading exceeds an alert threshold, and it will return to 15 minute sampling once it is no longer triggering the alert.
Set a lower threshold for alert? (Y/n)
>Y
Set alert analog lower threshold: 20

Set an upper threshold for alert? (Y/n)
>Y
Set alert analog upper threshold: 40Enter the upper and lower thresholds. You may enter either or both. If you are using calibration/scaling as in the example above, enter the thresholds in their scaled values.
In this example, the sensor will be put into the alert sample rate of 5 minutes if it reads a value that is less than 20psi or greater than 40psi.
NOTE: These settings only affect how often the sensor is sampled, NOT how often the data is transmitted to the API. To also transmit the data to the API at a different rate when an alert threshold has been met, you must also set the Alert sync rate to change to transmit data at a modified rate. For information on changing the Alert sync rate, please view the instructions on the Network Menu Reference Guide.
¶ Save Configuration
Once saved, the custom name if entered will be displayed, and it is possible to test read the sensor to get the converted and RAW values, by selecting option 5 and selecting the sensor to interrogate
Created psi

Sensor Config
        1: Add sensor
        2: Enable Battery monitor
        3: List sensors
        4: Delete sensor
        5: Test read sensors
        x: <Back

>xChoose <Back by pressing x.
Created psi

Sensor Config
        1: Add sensor
        2: Enable Battery monitor
        3: List sensors
        4: Delete sensor
        5: Test read sensors
        x: <Back

>x
Exiting...

neatMon Main Menu
        1: Network config
        2: Sensor config
        3: Utilities
        x: < Save & Quit

>xChoose Save & Quit by pressing x again. The node will reboot and you can re-enter the configuration and testing pages by entering “c” once the node re-initializes.
NOTE: If you don't do this the sensor will not be saved.
¶ Sample Sensor
First, you must open a serial terminal to the AMN and arrive at the neatMon Main Menu or enter “c” once the node has rebooted after saving and quitting in the previous step. If you're unsure how to open a new serial terminal, check the Opening Serial Terminal guide.
NeatMon Main Menu
        1: Network config
        2: Sensor config
        3: Utilities
        x: < Save & Quit

>2Choose Sensor config by pressing 2.
Sensor Config
        1: Add sensor
        2: Disable Battery monitor
        3: List sensors
        4: Delete sensor
        5: Test read
        x: <Back

>5Choose Test read by pressing 5.
Index   |       Sensor name     |        ID
--------------------------------------------------
0       |       Battery monitor |

--------------------------------------------------
1       |       psi              |       62254
        Type: adc [8]
        Sample rate (mins): 15
        Interface: I2C
        Port: 0
        Misc:
                Channel: A1
                M: 0.0417
                B: -25.0000
                Excitation time: 500ms
                Read time: 500ms
                Alert Sample Rate (mins): 5
                Alert Analog Lower Threshold: 20.00
                Alert Analog Upper Threshold: 40.00
Enter ID of sensor to read (x to cancel): 1Type the number related to the sensor just added.
nM+ A1 number of readings: 30
        Prescale:
                Last value: 696.00
                Average value: 695.00
                Max value: 705.00
        Scaled:
                Last value: 4.02
                Average value: 3.98
                Max value: 4.40
[ALERT] Analog output low!
[ALERT] Alert state on!
Read again? Y/n
It will now read the sensor and output the sensor data. Validate data desired- for example apply a known pressure to a pressure sensor and read the sensor. If calibration/scaling was applied in the firmware, both the raw (Prescale) mV readings and the calibrated (Scaled) readings will be shown here, however only the Scaled results will be sent to the API. Typically, the most valuable and accurate datapoint is the “Average value", measured at 3.98 psi in the example above.
If an Alert sample rate has been configured, it will report if a threshold has been met. For example, the low threshold alert was met in the example above as the result of 3.08 psi was less than the Lower Threshold that was set a 20 psi.
Measured Value Guide:
| Name In Firmware | Name Posted to API | Description of Measurement |
| Last value: | psi: v | Last datapoint collected (reading #30 of 30 in the example above) |
| Average value: | psi: avg | Average of all datapoints collected during the measurement (average of all 30 readings in the example above) |
| Max value: | psi: max | Highest datapoint collected (highest single datapoint of the 30 readings collected) |